Using Windows Traceroute
Network connection problems slow you down and are very annoying. Often you need to figure out why you suddenly don't have a network connection. The next time you face such a problem, you can run a traceroute to find exactly where your connection is failing. The traceroute command will give you information about the status of your website, your Internet connection, and much more. You can then share this information with technical support to fix your network connectivity issues. In this article, you will learn how to run and analyze a Windows traceroute command.
What is a traceroute?
A traceroute command is used as a diagnostic tool to determine the source of networking errors as well as determine the number of network hops and report on latency. This diagnostic information is useful in the case that you are trying to access a particular resource but are experiencing a slow response. The traceroute command provides clients with greater insight into at which network hop an issue occurs.
The traceroute command can be used on a variety of operating systems.
How to run a Windows traceroute command
To run a traceroute on Windows, simply follow the steps outlined below.
Open the Windows start menu and search for "cmd".
From the search results, open the command prompt.
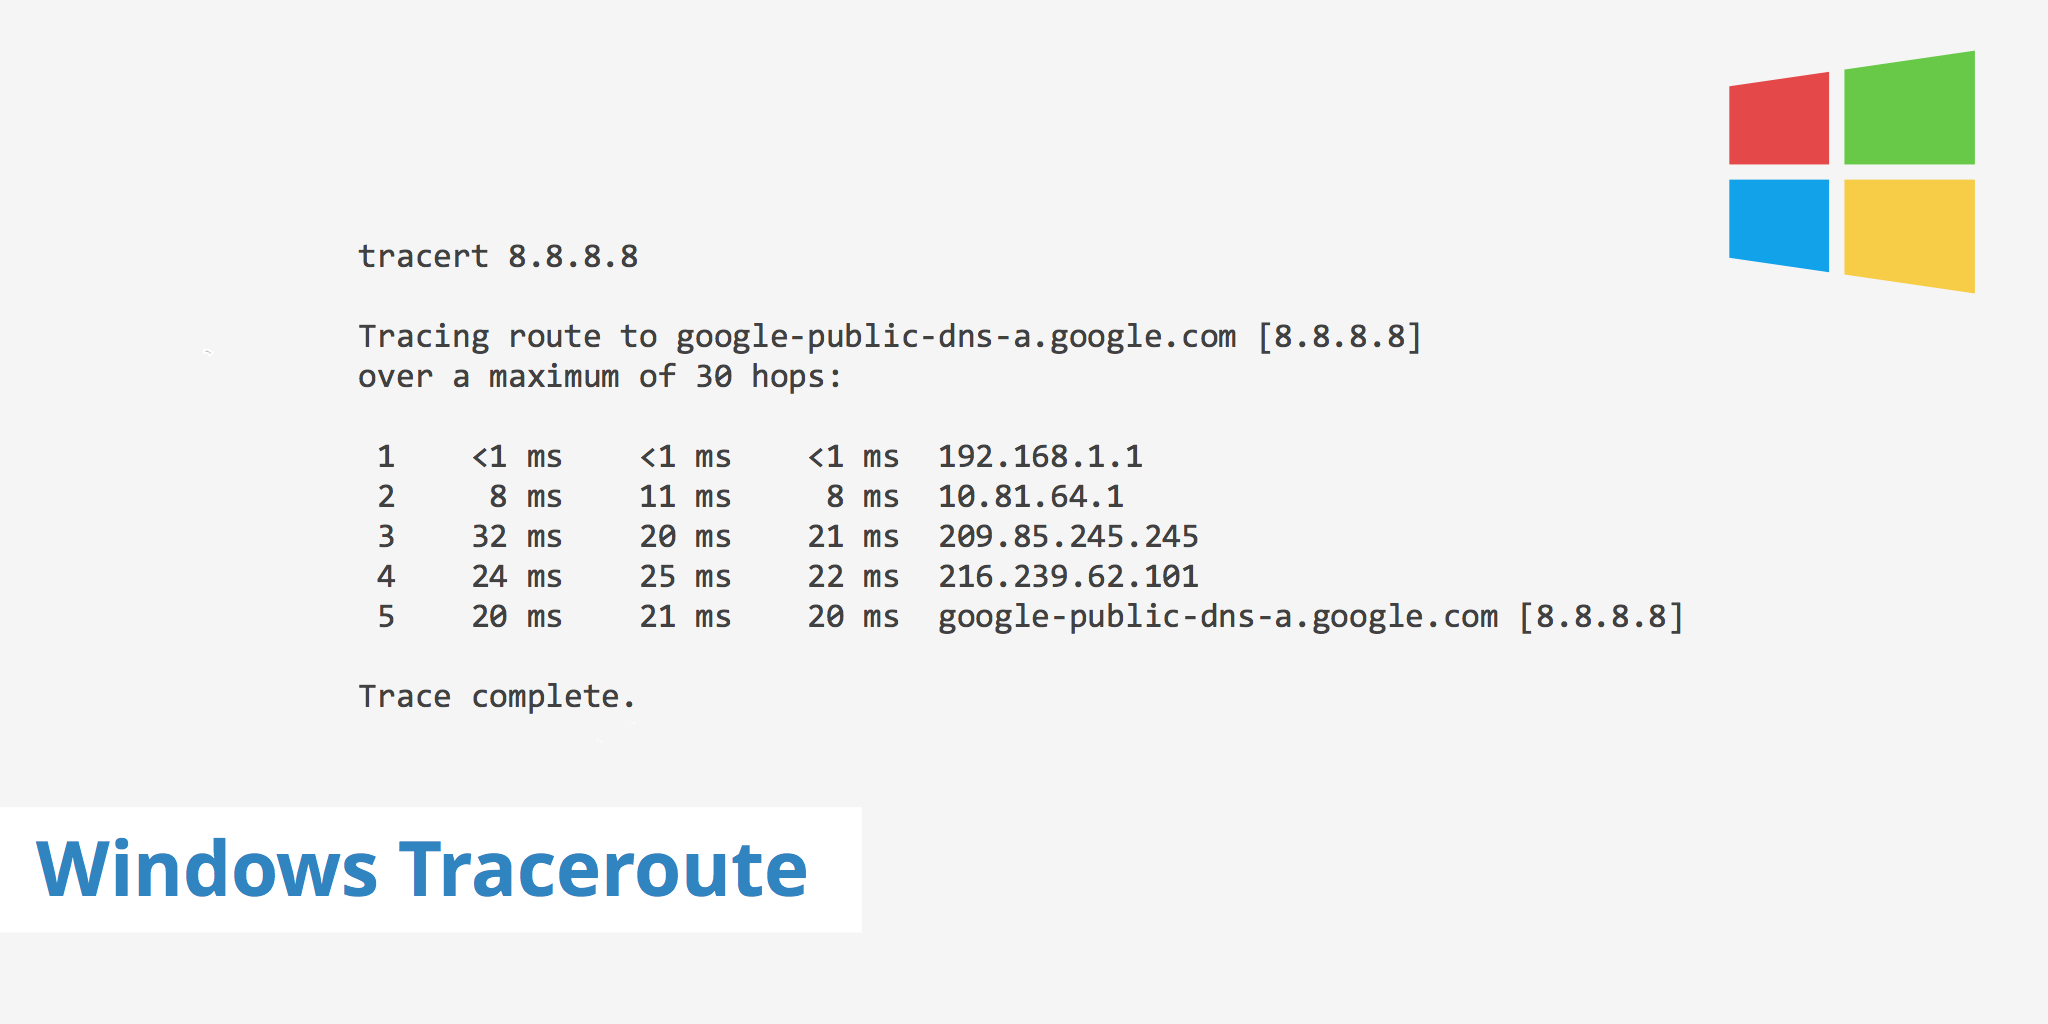
The traceroute command for windows is
tracert [hostname]. Therefore, use the tracert command and include the hostname against which you want to run a traceroute. For example, from my location, running a tracert against Google's DNS8.8.8.8returns the following:tracert 8.8.8.8 Tracing route to google-public-dns-a.google.com [8.8.8.8] over a maximum of 30 hops: 1 <1 ms <1 ms <1 ms 192.168.1.1 2 8 ms 11 ms 8 ms 10.81.64.1 3 9 ms 8 ms 9 ms 100.127.71.34 4 13 ms 9 ms 9 ms 70.169.74.150 5 23 ms 24 ms 21 ms langbprj02-ae1.0.rd.la.cox.net [68.1.1.14] 6 20 ms 21 ms 20 ms 72.14.215.221 7 32 ms 20 ms 21 ms 209.85.245.245 8 24 ms 25 ms 22 ms 216.239.62.101 9 20 ms 21 ms 20 ms google-public-dns-a.google.com [8.8.8.8] Trace complete.In most cases, the hostname value will be the website or IP address you want to diagnose for networking issues.
Once the traceroute is complete you can optionally copy the output with a simple copy and paste or right click within the window, Select all, and press Enter.
You can also perform an IPv6 traceroute using the following command: tracert -6 [hostname]. Now that you're aware of how to perform a Windows traceroute, the next step is knowing what to look for within the results.
Analyzing your Windows traceroute
Once you've run the tracert command for a particular hostname and received the results, you may be wondering how to analyze the output. Each row of the traceroute output is basically broken into 5 sections. For instance, let's take the 6th row of the traceroute from the example above.
6 20 ms 21 ms 20 ms 72.14.215.221
To break it down, this row corresponds to the following 5 separate pieces:
| Hop # | RTT 1 | RTT2 | RTT3 | Hostname (IP) |
|---|---|---|---|---|
| 6 | 20 ms | 21 ms | 20 ms | 72.14.215.221 |
Each column has a meaning which is explained as follows:
- Hop # - The hop # corresponds to the number of network hops the packet is currently on. In the example above, the packet is at network hop #6.
- RTT 1, RTT 2, RTT 3 - The three RTT columns correspond to the round trip time of each packet. That is, the amount of time it took for the packet to reach the particular hostname and return to its point of origin (i.e. your machine).
- Hostname - This displays the IP address of each router. If available, the domain name will sometimes also be displayed.
As for what to look for, when analyzing your Windows traceroute, it is important to carefully look at the RTT times for each hop. A sudden increase in RTT, which continues to increase upon subsequent hops, may indicate an issue with a particular router.
However, sudden jumps in RTT do not always indicate an issue. For example, it could be that for a particular hop, the RTT times increase. However, for subsequent hops, they return to normal. This could indicate that the router has set the signal to a lower priority, although it does not indicate an issue with the router per se.
Users making use of the functionality of traceroute implement MTR to help further diagnose networking issues. MTR is similar to traceroute; however, it combines both the functionality of ping as well as traceroute. It offers much more comprehensive output results and allows you to specify certain directives which aren't possible with traceroute. To learn more about MTR, read our MTR Traceroute Command article.