Traceroute Command
What is a traceroute command?
When data is sent over the Internet, it is sent in small pieces of data called packets. The data is broken up into multiple small packets before it is sent and once all packets reach their destination, the original message is recompiled. A traceroute sends Internet Control Message Protocol (ICMP) packets to test connections and report on latency between two points of the Internet. It can be used to help diagnose networking errors and is accessible by using the traceroute command directly or by using the further developed MTR command.
MTR, also known as My Traceroute, is a tool that combines the functionality of Ping and Traceroute. While the traceroute command can show the path a packet takes across the network, it cannot provide real-time monitoring of network performance metrics such as packet loss and latency. The ping command, on the other hand, can provide real-time monitoring of network performance metrics, but it does not show the path a packet takes across the network.
MTR fills this gap by combining the capabilities of traceroute and ping. It continuously sends packets to a destination host and provides real-time statistics on network performance metrics such as packet loss and latency. It also shows the path each packet takes across the network, providing insights into the network topology and potential points of failure.
MTR has several advanced features that make it a powerful network diagnostic tool. For example, it can perform DNS lookups to resolve IP addresses, support both IPv4 and IPv6, and allow for customization of packet size and frequency. It can also generate reports and graphs of network performance metrics for easy analysis and sharing.
How does traceroute work?
When you execute the traceroute command, it sends out a series of packets to the destination address with a TTL value of 1, 2, 3, and so on, up to a maximum value that you can specify. Each packet has a unique TTL value, so when it reaches a router, the router will decrement the TTL by one before forwarding it on to the next hop. If the TTL reaches zero, the router will send back an ICMP "Time Exceeded" message to the sender. The sender then records the IP address of the router that sent the ICMP message and the time it took for the packet to travel from the sender to that router.
The traceroute repeats this process with increasingly larger TTL values until it reaches the destination address or until it hits the maximum TTL value that you specified. Once it reaches the destination, it will display the path that the packets took to get there, along with the time it took for each hop. This information can be useful in identifying where network issues are occurring.
Ping
Ping is a tool used to determine whether a specific IP is reachable. When a user pings a host, packets are sent to that host and once they are received, the host returns those packets to the user's client. This allows for the round trip time to then be calculated by the client. The example below shows a few pings to Google's public DNS and the roundtrip time it took for the ping to be sent and received.
$ ping 8.8.8.8
PING 8.8.8.8 (8.8.8.8): 56 data bytes
64 bytes from 8.8.8.8: icmp_seq=0 ttl=56 time=54.524 ms
64 bytes from 8.8.8.8: icmp_seq=1 ttl=56 time=43.423 ms
64 bytes from 8.8.8.8: icmp_seq=2 ttl=56 time=50.773 ms
Traceroute command
When packets are sent across the internet, they must hop from network to network. The traceroute command, as the name implies, traces the route that packets takes to reach the host. It will show you how many hops it takes to reach the host and how long it took between each hop. This allows you to diagnose potential networking bottlenecks. The example below shows the traceroute output from a local machine to Google's public DNS. Alternatively, you can use our traceroute tool which will display the hops required for a particular domain from 10 different locations.
$ traceroute 8.8.8.8
traceroute to 8.8.8.8 (8.8.8.8), 64 hops max, 52 byte packets
1  192.168.0.1 (192.168.0.1)  6.632 ms  9.659 ms  10.089 ms
2  10.89.0.1 (10.89.0.1)  29.867 ms  14.293 ms  30.259 ms
3  blk-212-126-117.eastlink.ca (173.212.126.117)  20.677 ms  19.575 ms  20.155 ms
4  ns-hlfx-dr002.ns.eastlink.ca (24.215.102.161)  30.093 ms  29.371 ms  30.796 ms
5  ns-hlfx-br002.ns.eastlink.ca (24.215.102.221)  29.540 ms  29.516 ms  29.989 ms
6  ns-hlfx-br001.ns.eastlink.ca (24.215.102.9)  26.678 ms  29.203 ms  30.787 ms
7  google.eastlink.ca (24.215.101.10)  49.027 ms  49.196 ms  90.601 ms
8  209.85.241.127 (209.85.241.127)  49.999 ms
72.14.239.75 (72.14.239.75)  48.939 ms
72.14.235.169 (72.14.235.169)  46.823 ms
9  google-public-dns-a.google.com (8.8.8.8)  49.465 ms  45.436 ms  43.772 ms
Traceroute Options
The traceroute tool has several options that you can use to customize its behavior. Here are a few of the most commonly used options:
- -I: Use ICMP echo requests instead of UDP packets.
- -n: Do not resolve hostnames to IP addresses.
- -q: Set the number of packets sent per hop.
- -w: Set the timeout for waiting for a response.
- -m: Set the maximum TTL value for the packets.
To use an option, simply append it to the end of the traceroute command. For example, to use ICMP echo requests instead of UDP packets, you would use the following command:
traceroute -I 8.8.8.8
Together, ping and traceroute essentially form MTR. MTR also collects additional information regarding the state, connection, and responsiveness of the intermediate hosts making it a superior tool in identifying networking problems.
Installing MTR
Unlike traceroute, MTR is not necessarily installed by default. In order to install MTR, enter one of the following commands based on your system.
Debian/Ubuntu
sudo apt-get install mtr
CentOS/Fedora
yum install mtr
Arch
pacman -S mtr
If you want to install MTR on your local macOS, you can do so with Homebrew by running the following command.
brew install mtr
Generating an MTR report
Once you have MTR installed on your unix-based system you can start generating reports by running the following command
mtr --report domainx.com
Replace domainx.com with the domain URL or IP address you would like to generate a report for. An example MTR report for a local connection to Google's public DNS would resemble the following:
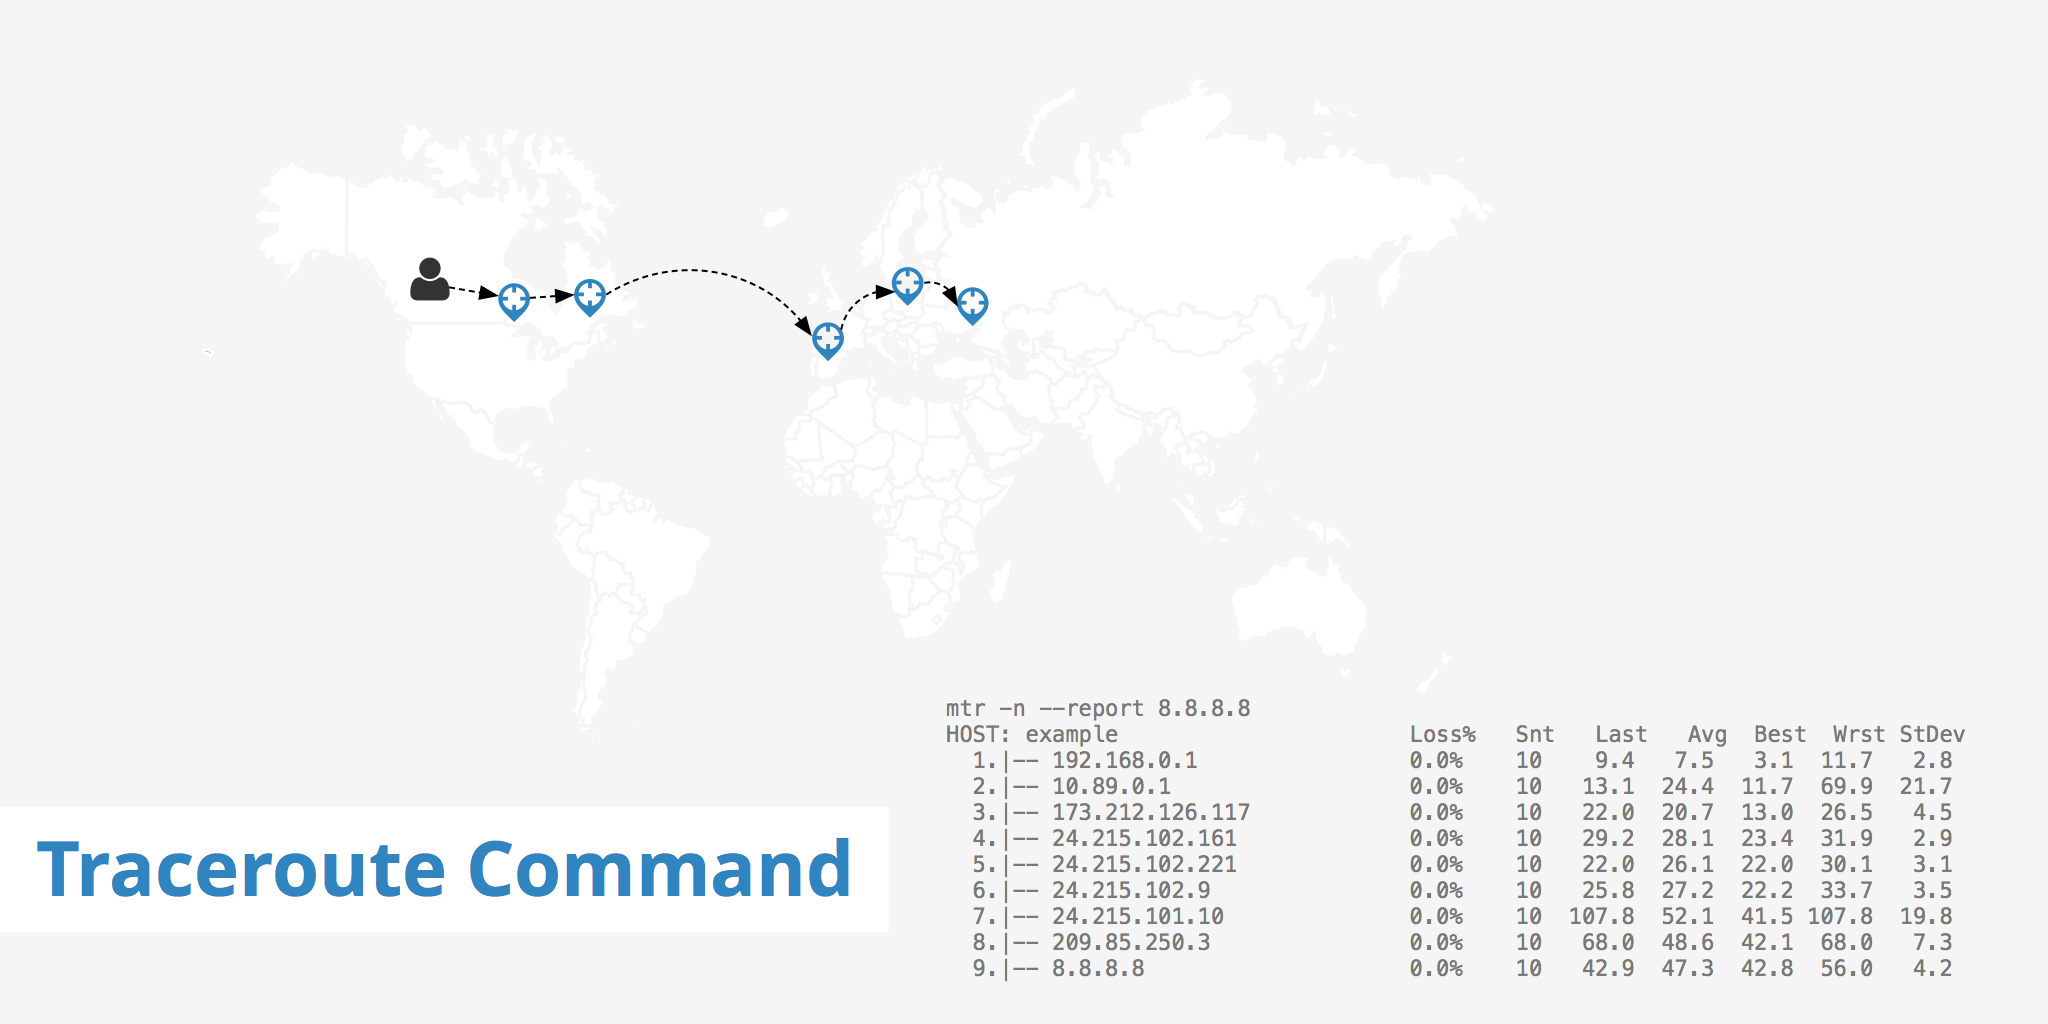
mtr -n --report 8.8.8.8
Start: Thu Oct  1 10:00:49 2015
HOST: example                      Loss%   Snt   Last   Avg  Best  Wrst StDev
1.|-- 192.168.0.1                0.0%    10    9.4   7.5   3.1  11.7   2.8
2.|-- 10.89.0.1                  0.0%    10   13.1  24.4  11.7  69.9  21.7
3.|-- 173.212.126.117            0.0%    10   22.0  20.7  13.0  26.5   4.5
4.|-- 24.215.102.161             0.0%    10   29.2  28.1  23.4  31.9   2.9
5.|-- 24.215.102.221             0.0%    10   22.0  26.1  22.0  30.1   3.1
6.|-- 24.215.102.9               0.0%    10   25.8  27.2  22.2  33.7   3.5
7.|-- 24.215.101.10              0.0%    10  107.8  52.1  41.5 107.8  19.8
8.|-- 209.85.250.3               0.0%    10   68.0  48.6  42.1  68.0   7.3
9.|-- 8.8.8.8                    0.0%    10   42.9  47.3  42.8  56.0   4.2
When using mtr -n --report like the example above, the -n tells MTR to display each hostname as an IP address. By using the report option, MTR will send 10 packets to 8.8.8.8 and generate the output. You may also use mtr domainx.com without the -report or -n options to kick off an interactive environment where you can monitor current round trips to the host.
Each column in the MTR report displays specific information about the packets sent. The following will outline what each section means.
- Host: Displays the hostname or IP at each hop the packet must travel
- Loss %: The percentage of packet loss at each hop
- Snt: The number of packets sent
- Last: The latency of the last packet sent
- Avg: Theaverage latency of all packets
- Best: Displays the shortest round trip for a packet
- Wrst: Displays the longest round trip for a packet
- StDev: Displays the standard deviation of the latencies to each host
Analyzing an MTR report
The primary things to look out for when analyzing MTR reports are packet loss and latency.
Loss
Loss can indicate there is something wrong with a particular router however, this can also be misleading as loss can be caused for a few reasons including rate limiting by the service provider. In the example below, there is packet loss of 60% between hop 2 and 3 however, for all other subsequent hops there is no packet loss. In a scenario like this, it is safe to assume that the one time 60% loss is due to rate limiting by the service provider.
mtr -n --report 8.8.8.8
Start: Thu Oct  1 10:00:49 2015
HOST: example                      Loss%   Snt   Last   Avg  Best  Wrst StDev
1.|-- 192.168.0.1                0.0%    10    9.4   7.5   3.1  11.7   2.8
2.|-- 10.89.0.1                  0.0%    10   13.1  24.4  11.7  69.9  21.7
3.|-- 173.212.126.117            60.0%    10   22.0  20.7  13.0  26.5   4.5
4.|-- 24.215.102.161             0.0%    10   29.2  28.1  23.4  31.9   2.9
5.|-- 24.215.102.221             0.0%    10   22.0  26.1  22.0  30.1   3.1
6.|-- 24.215.102.9               0.0%    10   25.8  27.2  22.2  33.7   3.5
7.|-- 24.215.101.10              0.0%    10  107.8  52.1  41.5 107.8  19.8
8.|-- 209.85.250.3               0.0%    10   68.0  48.6  42.1  68.0   7.3
9.|-- 8.8.8.8                    0.0%    10   42.9  47.3  42.8  56.0   4.2
If there is loss on more than one hop it is possible that there may be a router issue at play. The example below shows that starting at hop 4 there is a packet loss of 70%. However, the last hop shows that the packet loss is only 30%. It should be noted that packet loss and rate limiting can both take place at the same time. This would likely be the case in the below example as it seems there is a true packet loss of only 30% while the remainder for hops 4, 5, and 6 would be due to ICMP rate limiting. When different amounts of loss are reported, always trust the numbers from the later hops.
mtr -n --report 8.8.8.8
Start: Thu Oct  1 10:00:49 2015
HOST: example                      Loss%   Snt   Last   Avg  Best  Wrst StDev
1.|-- 192.168.0.1                0.0%    10    9.4   7.5   3.1  11.7   2.8
2.|-- 10.89.0.1                  0.0%    10   13.1  24.4  11.7  69.9  21.7
3.|-- 173.212.126.117            0.0%    10   22.0  20.7  13.0  26.5   4.5
4.|-- 24.215.102.161             70.0%    10   29.2  28.1  23.4  31.9   2.9
5.|-- 24.215.102.221             70.0%    10   22.0  26.1  22.0  30.1   3.1
6.|-- 24.215.102.9               60.0%    10   25.8  27.2  22.2  33.7   3.5
7.|-- 24.215.101.10              30.0%    10  107.8  52.1  41.5 107.8  19.8
8.|-- 209.85.250.3               30.0%    10   68.0  48.6  42.1  68.0   7.3
9.|-- 8.8.8.8                    30.0%    10   42.9  47.3  42.8  56.0   4.2
Internet protocols were created to be resilient to a certain amount of network degradation. Losses in the range of 10% are usually nothing to worry about, however, if these numbers increase there may be an underlying issue worth looking into. Depending on which hop the packet loss is occurring, you can get a better idea on where the issue may be. Some loss can also be explained by the return route due to packets sometimes having a hard time making the return trip. For this reason, it is recommended to collect MTR or traceroute reports for both directions (to and from your host) when collecting data.
If you're running the MTR report locally and see significant packet loss in the first few hops, there may be an issue with your ISP. Alternatively if the packet loss occurs in the last few hops there may be an issue with the host's ISP. However, if there is packet loss within the intermediary hops this may be more difficult to diagnose.
Latency
Latency is another metric you are able to measure with the use of MTR reports. Latency is very dependent on both the network quality and distance of the host. However, similar to packet loss, latency can be caused for a variety of reasons such as saturated peering sessions, a misconfigured router, or a congested link. When analyzing the MTR report for network latency, it is important to look for sudden spikes that may indicate an issue with a particular router in the route.
In the example below, latency looks normal until it reaches hop number 6. At this hop there is a large jump in latency which is not reduced in subsequent hops. From this data, it is safe to assume there is an issue with the 6th router.
mtr -n --report 8.8.8.8
Start: Thu Oct  1 10:00:49 2015
HOST: example                      Loss%   Snt   Last   Avg  Best  Wrst StDev
1.|-- 192.168.0.1                0.0%    10    9.4   7.5   3.1  11.7   2.8
2.|-- 10.89.0.1                  0.0%    10   13.1  24.4  11.7  69.9  21.7
3.|-- 173.212.126.117            0.0%    10   22.0  20.7  13.0  26.5   4.5
4.|-- 24.215.102.161             0.0%    10   29.2  28.1  23.4  31.9   2.9
5.|-- 24.215.102.221             0.0%    10   22.0  26.1  22.0  30.1   3.1
6.|-- 24.215.102.9               0.0%    10  430.4 445.2 426.7 463.6   3.5
7.|-- 24.215.101.10              0.0%    10  432.3 445.2 426.7 463.6   3.8
8.|-- 209.85.250.3               0.0%    10  433.5 445.2 426.7 463.6   7.3
9.|-- 8.8.8.8                    0.0%    10  435.9 445.2 426.7 463.6   4.2
Alternatively, using the same example above, if the latency had jumped at hop number 6 and then returned to normal for the subsequent hops, we could assume that this was caused due to ICMP rate limiting. Similar to packet loss, packet latency can also be affected by rate limiting. Thus the latency data of the last hop should be the primary data to take into consideration when evaluating the MTR report.
To learn more about latency, read our network latency article.
Summary
The MTR or traceroute command offers the ability to detect networking bottlenecks and speed up the troubleshooting process. With a detailed representation of packet loss and latency times for each hop in a route, it provides users the ability to pinpoint potential problem areas. Most issues detected in an MTR report will usually clear up in 24 hours as ISPs have most likely already detected the issue. However, having this information at your disposal can further help service providers troubleshoot issues that are user specific, resulting in faster resolve times.